Thickness determination of coating layers


Challenge
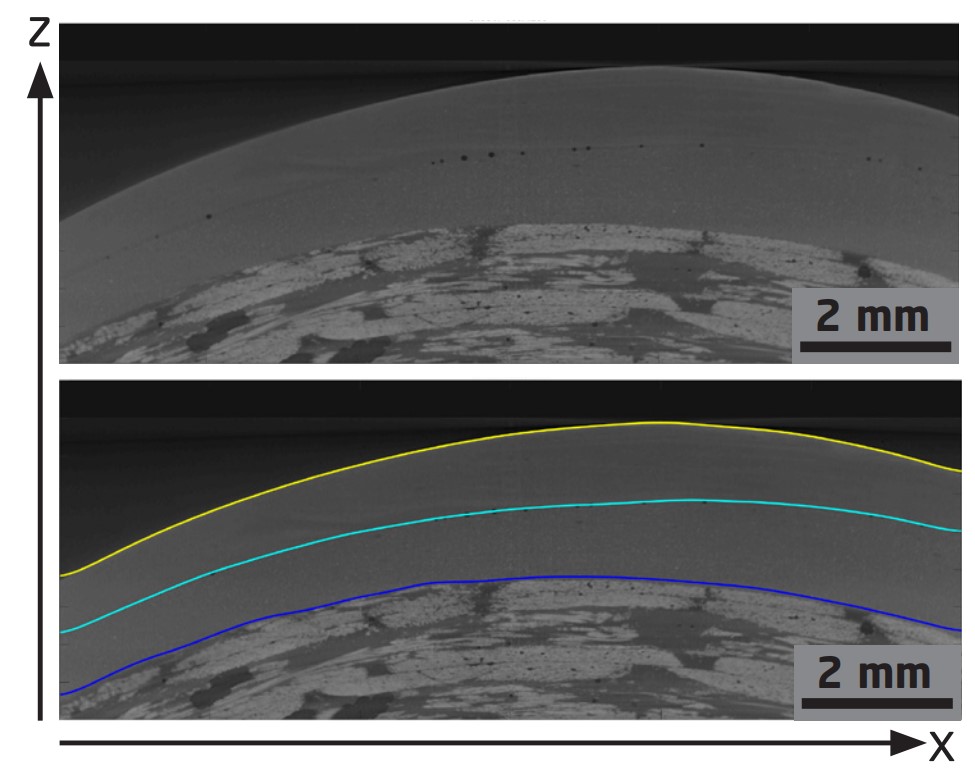
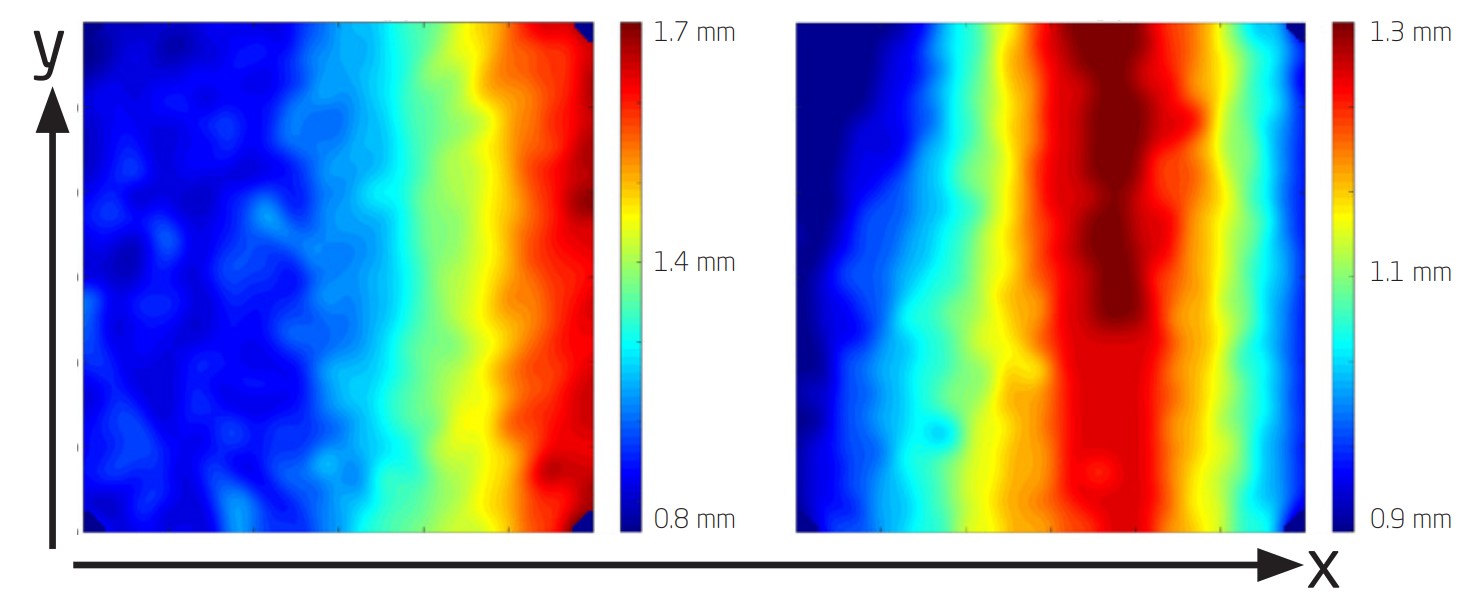
X-ray micro Computed Tomography (CT) can be used to study the thickness of the gelcoat in a volume rather than by cutting individual slices. The obtained 3D images clearly show fibres and the coating, but it is challenging to discern the two coating layers due to their similar X-ray absorption properties. Thus, the challenge in this project was to separate the coating layers and to determine their thickness along the curved geometry of the samples to produce a thickness map.
Collaboration
Through the collaboration between LM wind power and the 3D Imaging Centre at DTU, the materials were charactersed using micro X-ray CT scans and in-house developed analysis tools. This collaboration was part of the LINX project in which researchers at leading Danish universities collaborate with scientists in industry to solve industry relevant problems using advanced neutron and X-ray techniques.
Results
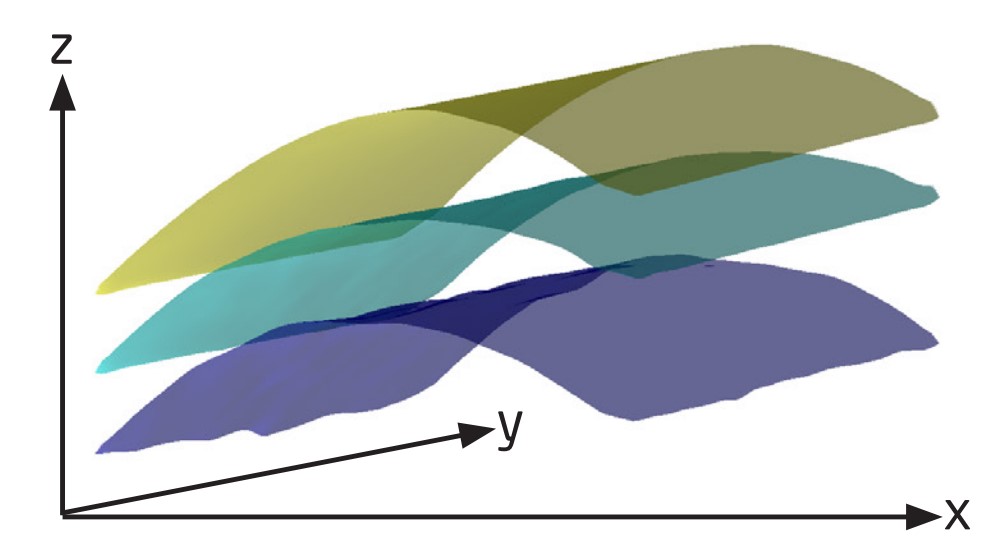
Two different sample types were studied using a Nikon XT H 225 industrial CT scanner at the 3D Imaging Centre at DTU. One sample type had two gelcoat layers on top of each other, while the other one had an aluminium layer inbetween to enhance the visibility of the interface between the coating layers. Incorporating the aluminium layer facilitated the image analysis such that simple automatic analysis tools could be used to separate the two layers, but this material composition does not represent a real blade. When the realistic samples without aluminium were analysed, a slight difference between the gelcoat layers was visible to the human eye, but simple automatic analysis tools failed to differentiate between the layers. However, an automated detection of the layers is necessary in order to perform statistically valid analysis on a whole 3D volume. We therefore used more complex analysis tools developed in-house, which are based on surface detection algorithms. Using these tools, we could identify the different layers and determine the distance between the interfaces, corresponding to the coating layer thickness. With this procedure, we could show that CT imaging followed by dedicated image analysis can be applied to generate thickness maps along curved geometries, which can be used to study the thickness of gelcoat layers on wind turbine blades

