Tracking the location of components during operation

Challenge
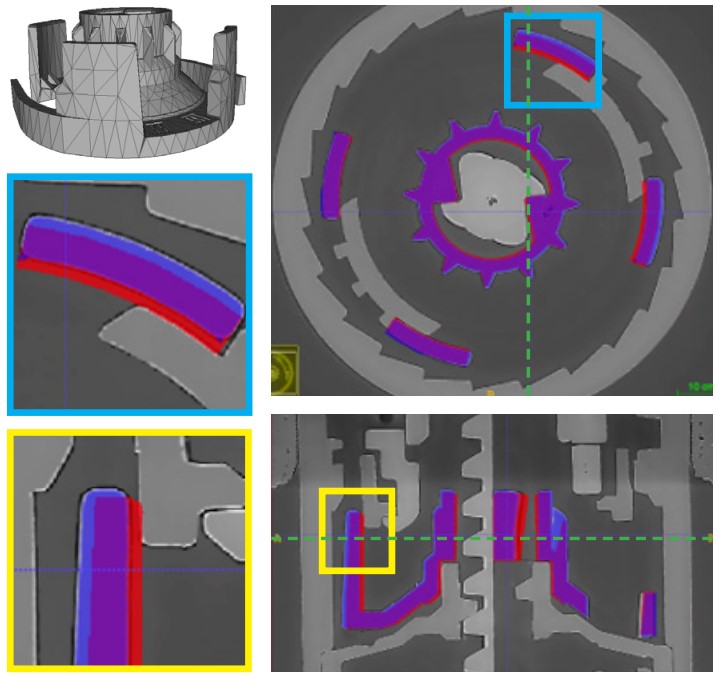
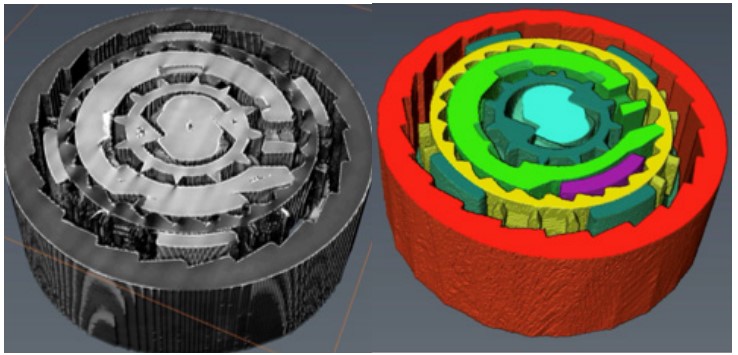
The 3D images obtained from the X-ray experiment contained noise and artefacts, which made visualisation challenging. To produce a high quality visualisation, we decided to give each component of the pen a unique colour. This requires a virtual extraction of the components for each individual time step. To solve this task, we incorporated prior knowledge about the geometry of the components, provided by Novo Nordisk as a CAD model.
Collaboration
This collaboration was part of the LINX project, in which researchers at leading Danish universities collaborate with scientists in industry to solve industry relevant problems using advanced neutron and X-ray techniques. Dedicated tools for image analysis were developed at the 3D Imaging Centre at DTU, while the X-ray experiment was carried out at the European Synchrotron Radiation Facility in Grenoble, France.
Results
The virtual extraction of the components was performed in 3 steps. First, the CAD model was aligned coarsely with a high quality static scan using manually annotated corresponding points. Second, a finer, automatic alignment, that also accounts for deformations, was performed to find the geometry of the produced components, which differ slightly from the design. Then, these geometries were used to find the position of each component while they move during the pen’s operation. This was achieved using an automatic registration method which provides an optimal alignment by matching intensity values. Through this process we were also able to estimate the rotation and translation angles for every component at each time step. This information provides the speed of rotation and translation of the components during the operation of the pen.
Perspectives
The process of tracking internal components using a priori knowledge about their geometry can be used to further understand the movements of internal components during operation, both for quality inspection, and also for testing new designs and production processes.

