Streamlining the analysis of stone wool fibres


Challenge
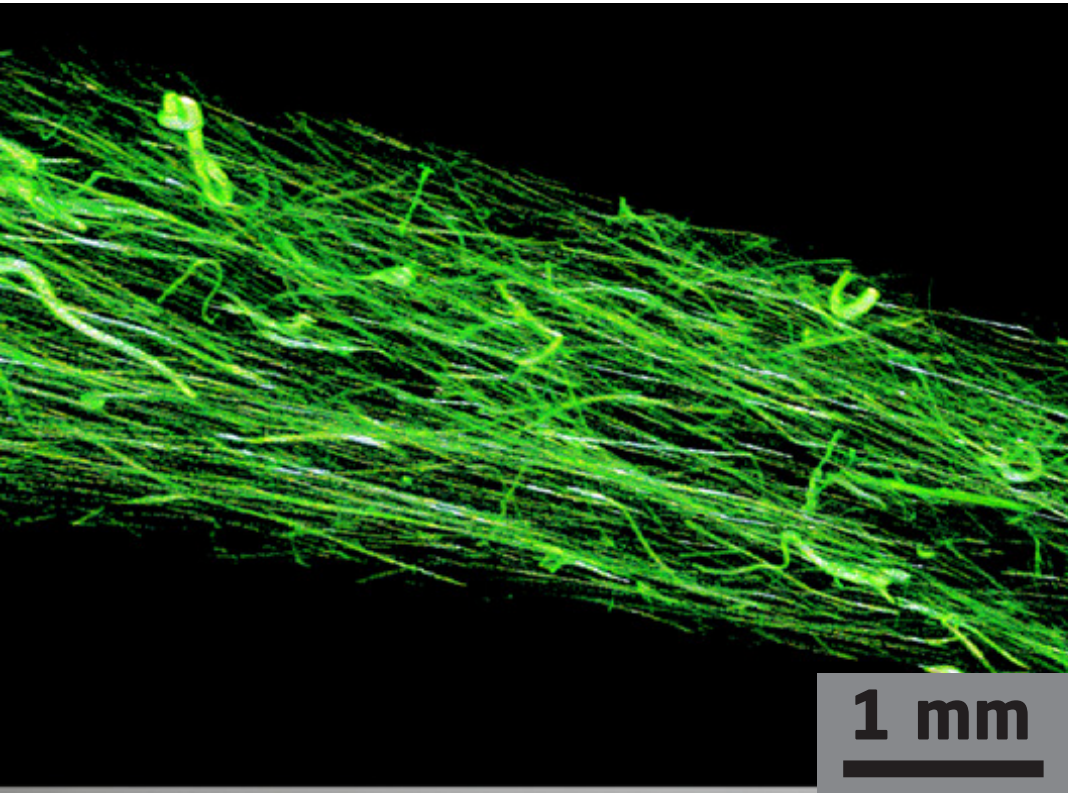
In earlier work with ROCKWOOL products it was determined that 6 overlapping volumes with a voxel size of 1.8 µm were needed to get a high-resolved representative section of the material. However, this leads to a scan time of 108 hours. To reduce this time we lowered the number of projections, i.e. the number of images taken during one acquisition, and studied its impact on the fibre analysis results.
Collaboration
ROCKWOOL provided the 3D Imaging Centre at DTU with samples of stone wool. These were imaged in house by X-ray CT and subsequently analysed. This collaboration was part of the LINX project in which researchers at leading Danish universities collaborate with scientists in industry to solve industry relevant problems using advanced neutron and X-ray techniques.
Results
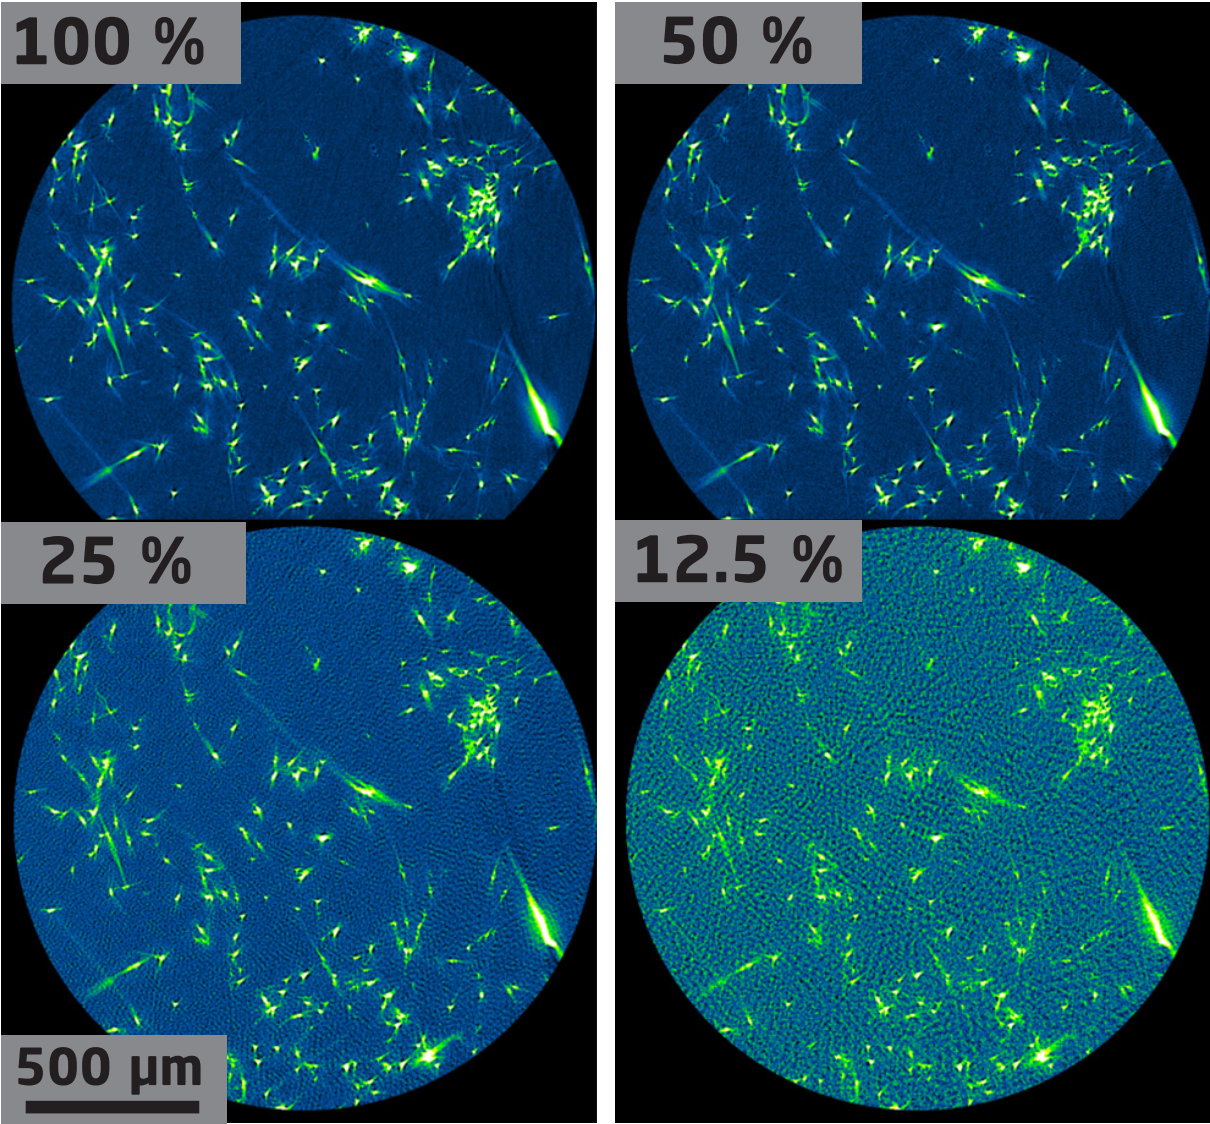
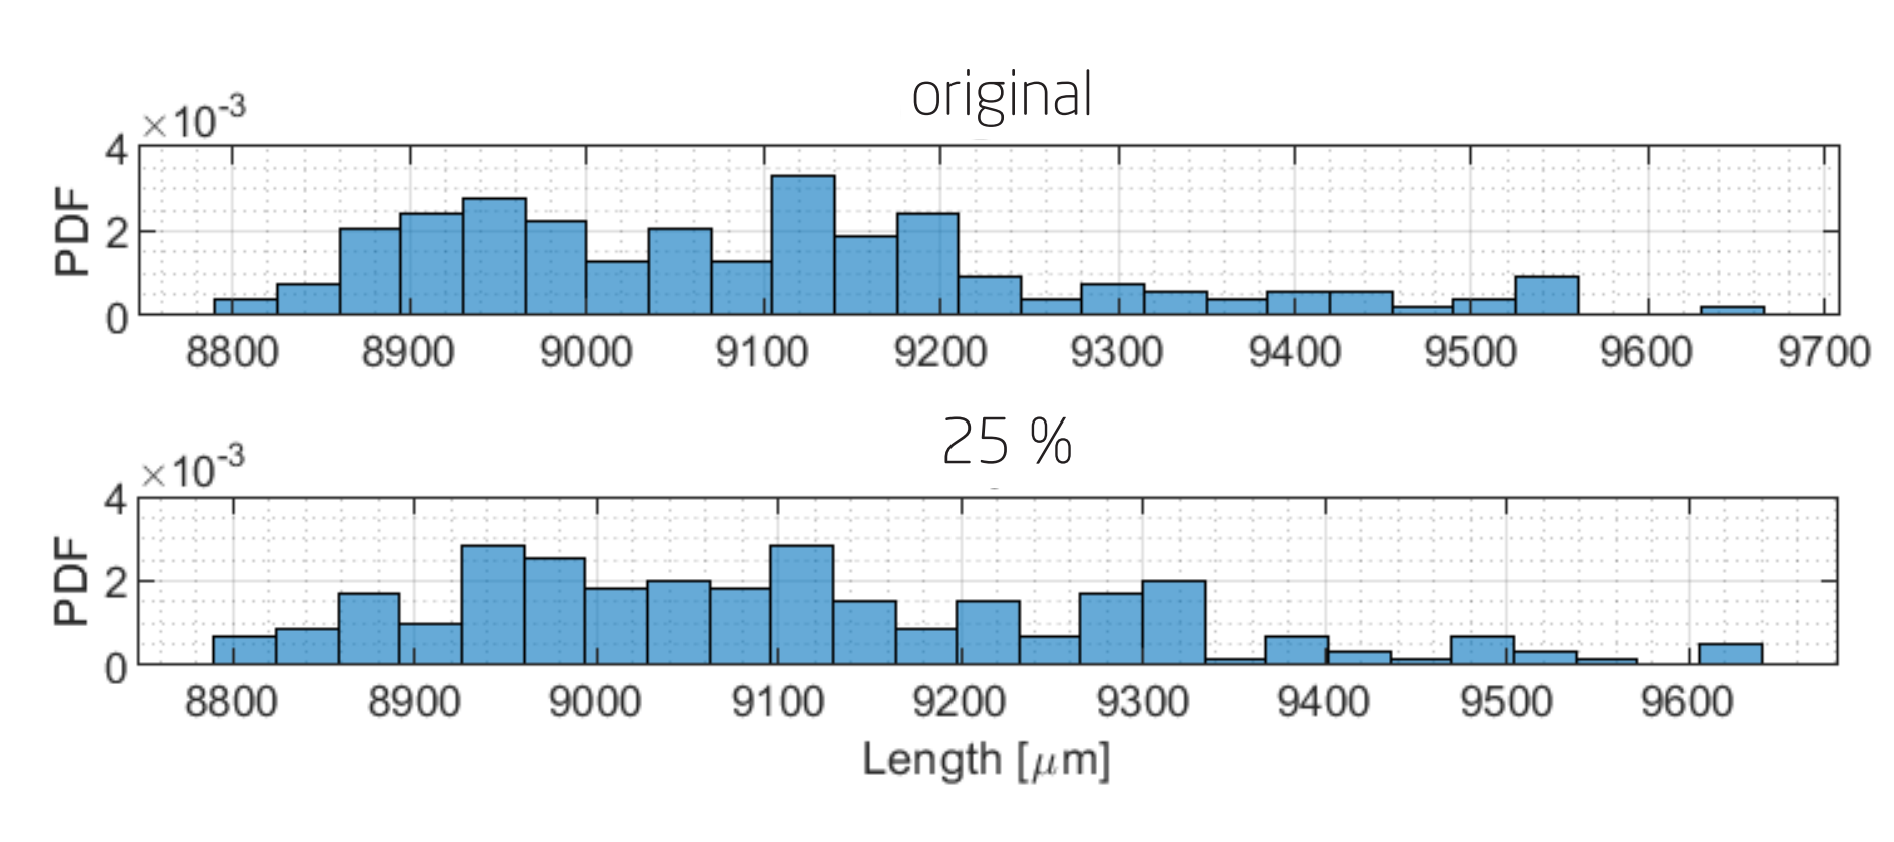
The fibre tracking algorithm, developed by the 3D Imaging Centre at DTU and ROCKWOOL, allows to determine the length and radii of stone wool fibres, if the image quality is sufficient. To obtain a good image quality, a large number of projections, i.e. 2D detector images of transmitted X-rays are taken from different angles, is used for the CT measurement. Reducing the number of projections leads to increased noise in the images and makes tracking the fibres in image analysis more difficult. For every sample, a representative volume was imaged with the ideal number of 3201 projections. To test the robustness of the fibre tracking algorithm, we also produced data sets using only 50 %, 25 % and 12.5 % of the projection images. The results for fibre analysis show little difference when reducing the number of projections down to 25 %, leading to a four times shorter acquisition time.
Perspectives
Our results have shown that the algorithms used in the fibre analysis are robust enough to work with only 25 % of the customary amount of projections. This, and a possible further reduction in scan time, will make CT an economically viable approach for ROCKWOOL to characterise their products.

